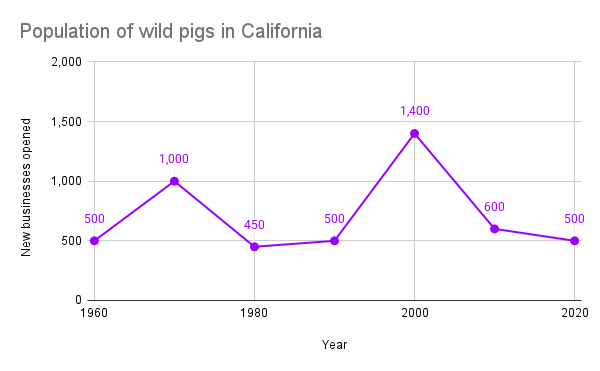
This line graph __________ changes in the wild pig pouplation of California over a sixty-year __________.
options:
illustrates / period
draws / timeframe
gives / era
1/5
illustrates / period
draws / timeframe
gives / era
This line graph __________ changes in the wild pig pouplation of California over a sixty-year __________.